PlumePGH Website Tracks Pollution Spread Across Pittsburgh
Aaron AupperleeTuesday, March 9, 2021Print this page.
Industrial pollution from one side of Allegheny County can stink up air on the other side of the county.
For years, the SmellPGH app from Carnegie Mellon University's CREATE Lab has allowed users to report and map foul odors throughout the region. Now, a new tool from the researchers tracks the stinky pollution's origin and how it correlates with reports of smelly air.
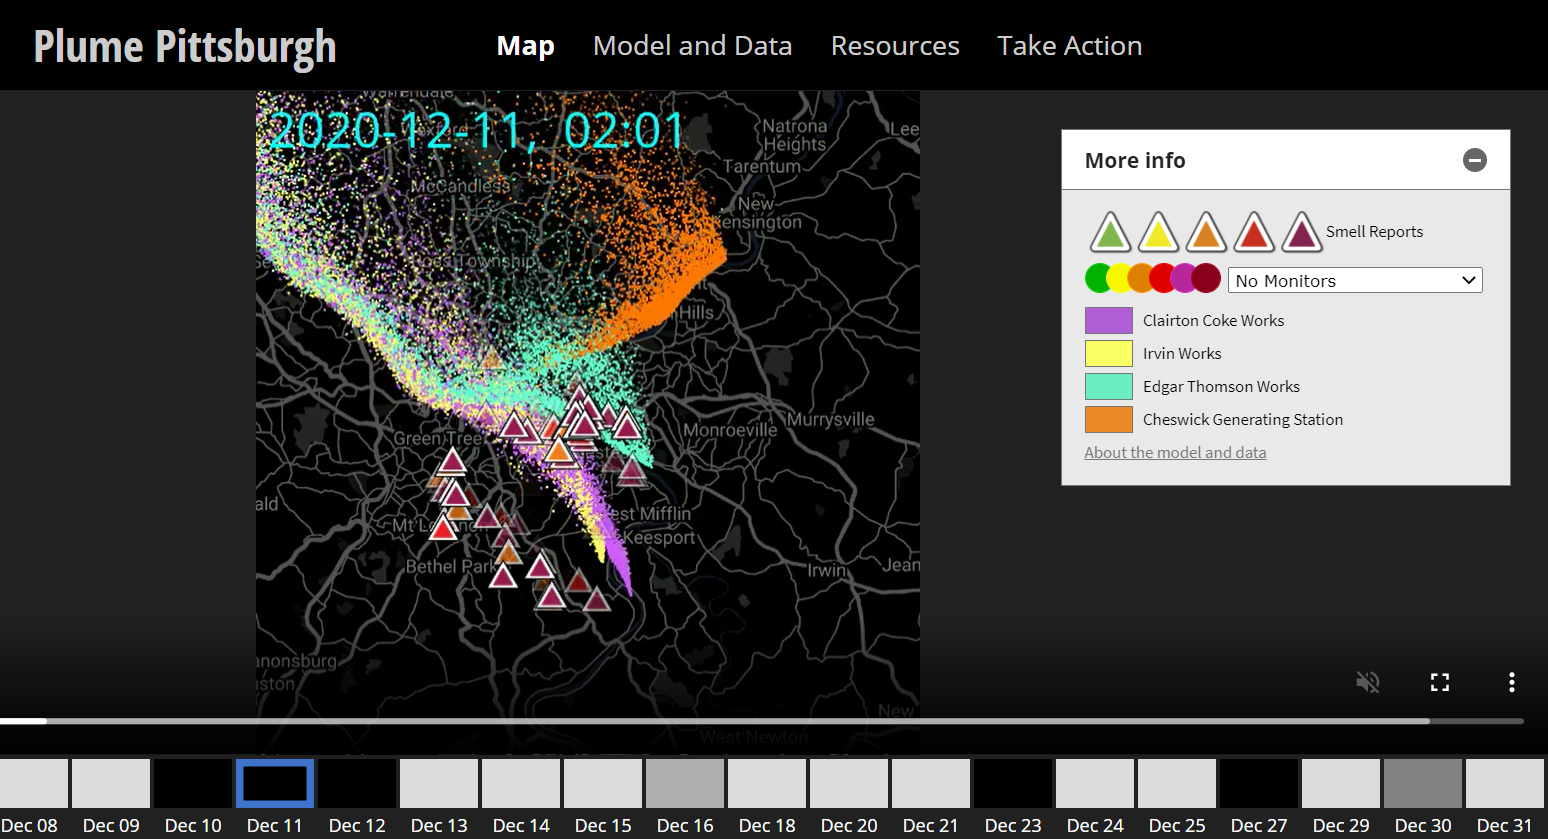
PlumePGH, a new website from the CREATE Lab in the university's Robotics Institute, uses detailed National Oceanic and Atmospheric Administration weather models to track how emissions spread throughout the region. Because sulfur emissions are the most likely to create a foul odor, PlumePGH tracks pollution from Allegheny County's four highest sulfur emitters — U.S. Steel's Clairton Coke Works, Irvin Works and Edgar Thomson Works, and the Cheswick Generating Station.
On the site, moving dots represent the plumes being tracked, while different colors denote the four pollution sources. Users can follow the dots as the air particles move according to the NOAA weather models. If the pollution rises and clears quickly, the dots become less dense.
The models on the PlumePGH website show how even miles from their sources, emissions maintain significant concentrations. This is especially true during atmospheric inversions, where cold air in the upper atmosphere traps warmer air — and pollution — near the Earth's surface. The greater Pittsburgh area experiences an average of about 157 inversion days per year, according to the Allegheny County Health Department.
SmellPGH information is layered on top of the PlumePGH data to show how the spreading pollution correlates with odor reports. Each triangle on the PlumePGH map represents a SmellPGH report, and their colors correspond to the severity of the smell. Colors range from yellow, representing a barely noticeable smell, to maroon, which represents an odor that is about as bad as it gets. Users can also add data from air quality monitors around the region to further validate the modeling and SmellPGH reports.
"The alignment of these independent data sources can help us understand whose health may be impacted by this industrial pollution," said Randy Sargent, director of visualization in the CREATE Lab. "The PlumePGH website lets you explore across time and find how pollution moved on any given day. You can explore smell reports and modeled pollution and add a variety of air quality monitoring data to the map as you engage in this effort to hold these industries accountable."
The PlumePGH website includes a "Take Action" tab with resources to help users report air quality concerns and raise awareness of pollution in their communities. Ana Hoffman, director of air quality engagement in the CREATE Lab, said the page will assist users in identifying the source of the pollution and could spur them to advocate for cleaner air. It also assures users they weren't alone in noticing an odor.
"It helps a person feel connected to other people who are experiencing pollution," Hoffman said. "We want this to be a technical resource — much like SmellPGH and the Breathe Cams — where someone experiencing a pollution event can go to add data to back up their concern."
Aaron Aupperlee | 412-268-9068 | aaupperlee@cmu.edu